After the release of Q2 2020 Medicare claims data, the Trella Health team analyzed and quantified some of the ways COVID-19 impacted post-acute care organizations through June of 2020. In our last article, we published a brief analysis comparing post-acute discharge destinations from Q2 2019, before the coronavirus pandemic, with destinations for COVID-19 patients discharged from a hospital stay during Q2 2020. This piece looks at skilled nursing utilization and admissions for the reporting period, plus provides a temporal view of unique patient admits to home health and SNF in relation to hospital discharges each month.
Highlights:
- National SNF utilization was 23.5% for the Q2 2020 reporting period
- Q2 2020 SNF admissions declined 21.4% year over year
- A 32.8% decrease in unique discharges from short-term acute care hospitals between March and April 2020 resulted in corresponding drops for home health and SNF unique patient admissions

Skilled Nursing Utilization and Admissions
How did COVID-19 impact SNF utilization and admissions in Q2 2020? National SNF utilization was 23.5% for the reporting period (Q3 2019 through Q2 2020). As is typically the case, utilization varied across states, ranging from a low of 7.5% in Alaska to a high of 30.6% in Connecticut.
Trella calculates SNF utilization as the number of SNF admissions, divided by the number of total inpatient discharges that occurred from Q3 2019 to Q2 2020. Note we calculate total admissions and discharges rather than unique patient admissions and discharges. Some patients may have more than one inpatient stay and/or multiple SNF admissions. These patients would be counted for each inpatient stay and SNF admission during the reporting period.
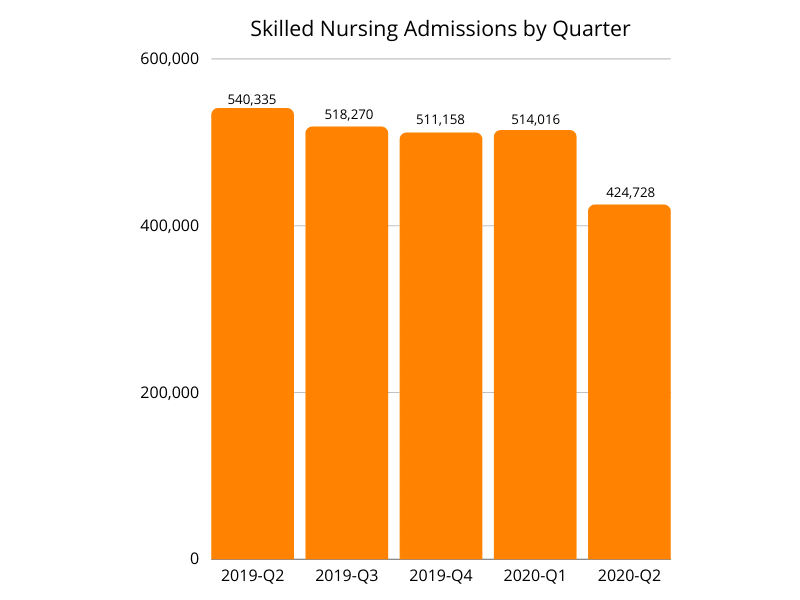
SNF admissions declined 21.4% year over year, dropping from 540,335 in Q2 2019 to 424,728 in Q2 2020*. Decreasing admissions in Q2 were likely impacted by the precipitous drop in the short-term acute care hospital patient population during the same time frame. For reference, SNF admissions in Q2 2018 were 565,735, slightly higher than in 2019 and considerably higher than in 2020.
Unique Patient Discharge and Admission Counts by Month
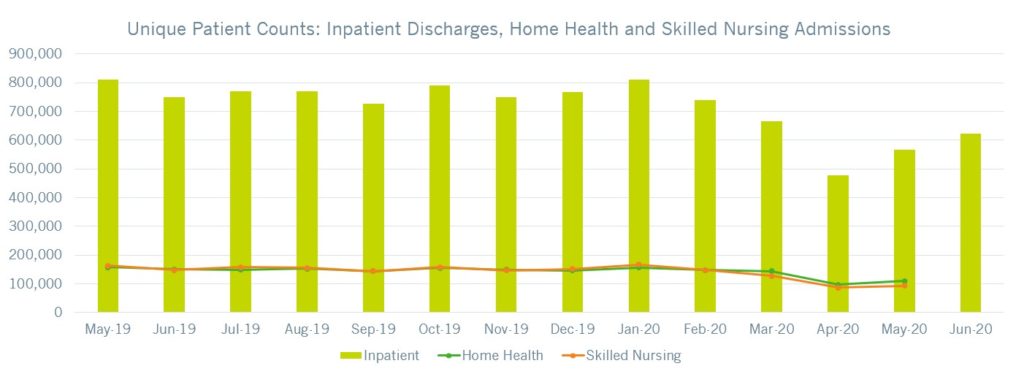
How were unique patient discharges and admissions impacted as a result of COVID-19? With 32.8% fewer unique patient discharges in April than in March 2020, both home health and SNF unique patient admissions saw significant decreases.

In the adjacent graph, the green line represents the number of unique patients admitted to home health during the month while the orange line represents those admitted to skilled nursing facilities. Except for a slight increase in unique patient admits to home health in May 2020, admissions remained relatively consistent for both SNF and home health agencies, despite an 18.5% increase in unique patient discharges from hospitals between April and May 2020. Note that due to the time frame allotted for claims processing, we have omitted unique home health and SNF patient admissions for June 2020. We did, however, want to show inpatient discharges continued to rebound from their April low.
Unique hospital discharges remained fairly consistent from May 2019 through March 2020. Beginning in Q2 2020, we see a notable decline in inpatient discharges, plus admissions to both home health and SNF. Based on previous trends and what we know about the response to the coronavirus pandemic, we can likely attribute this decline to holds and delays placed on elective and non-emergency procedures to free up capacity for COVID-19 patients while limiting the risk of virus exposure to other patients.
Conclusion
Our analysis of Medicare FFS claims between Q2 2019 and Q2 2020 uncovered a few trends and impacts of the coronavirus pandemic on our industry to date. Most notably, SNF and home health admissions declined, while SNF utilization also decreased. Even when unique patient discharges from hospitals began to pick back up in May, home health and SNF admissions only modestly increased from their April nadirs.
As the leader in provider performance outcomes insights and analytics, the Trella team continues to assess how COVID-19 has affected the acute and post-acute care markets. Along with our blog series highlighting COVID-19’s impact through Q2 2020, look for Trella’s annual Industry Trend Report in January 2021 for more analyses based on insights from the most recent Medicare claims data available.
*Trella recently made a change to our SNF episode logic. As a result of this change, you will notice a slight discrepancy for quarterly SNF admissions when comparing the quarters of data displayed in this piece to those displayed in our Q1 2020 post-acute care trends blog.


