Introduction
Trella Health has created a heatmap to visualize counties with large populations of patients considered high-risk for serious illness if infected with COVID-19, based on our access to 100% of Medicare Part A & B Fee-for-Service (FFS) claims data. Because chronic obstructive pulmonary disease (COPD) and congestive heart failure (CHF) are two conditions correlated with increased rates of hospitalizations and mortality in COVID-19 cases, we used the number of COPD+CHF patients in a county as the underlying criteria for the heatmap.
Trella felt it was important to highlight how many home health agencies operate in a county for multiple reasons. As acute care facilities focus on freeing up capacity for serious COVID-19 cases, home health providers can serve patients who require care after hospital discharge, regardless of their COVID-19 status. Home health agencies can also treat patients with confirmed COVID-19 cases who don’t require hospitalization, allowing acute facilities to direct resources to patients who require more critical care. Finally, understanding the number of COPD+CHF patients per home health agency in a given county can serve as a useful indicator in forecasting staffing and equipment needs. The higher the number of COPD+CHF patients per home health agency in a given area, the more likely agencies are to be overwhelmed as cases surge, potentially triggering staffing or personal protective equipment (PPE) shortages.
Methodology
As a starting point for our investigation, Trella identified the 50 counties with the highest number of Medicare FFS COPD+CHF patients and each county’s associated number of COVID-19 cases and deaths. To account for factors such as population density and variance in testing criteria across the nation, we also looked at both COPD+CHF patients and COVID-19 deaths on a per capita basis. Additional metrics we considered included average Medicare FFS patient age for the county and the number of COPD+CHF patients per home health agency. We then reviewed measures of vulnerability and anticipated peak resource information from external sources to complement our analysis. Our evaluation led us to select three clusters that have already been significantly impacted by COVID-19 and four that may represent future hotbeds.
Because the 50 counties with the highest number of COPD+CHF patients each had populations of at least 500,000, our findings reflect urban and suburban areas. We recognize that some rural counties are currently experiencing significant numbers of severe cases and deaths on a per capita basis, in addition to those that will emerge as areas of concern. Our analysis does not intend to suggest only metro areas with 500,000 people or more have populations at high risk for adverse outcomes during the pandemic.
Findings
1. Known Peak Areas
Trella assesses that the following known areas could provide useful trends and indicators for anticipating COVID-19’s effects in other parts of the country.
New York City, New York
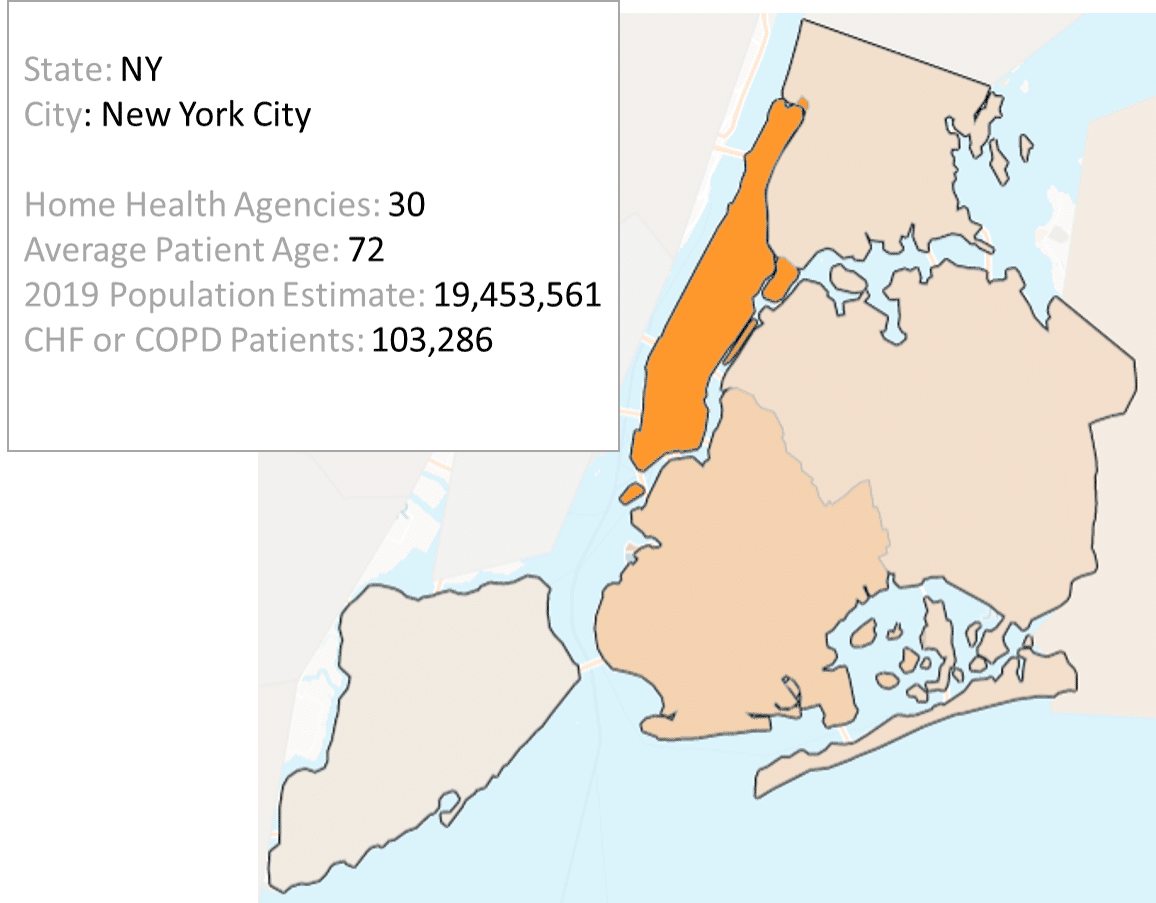
While New York City ranks fifth among the top 50 counties for number of COPD+CHF patients, its incidence of 5.31 per 1,000 people is the lowest of the group, reflecting just how densely populated the five boroughs are. As one of the first regions in the U.S. to experience mounting cases and associated mortalities, the New York metro faced added obstacles in its response to the pandemic: earlier and more uncertain projections and models, a national plan only in its nascence, and far less information about how COVID-19 spread and what preventative measures could protect people.
While the most recent estimates from the Institute for Health Metrics and Evaluation (IHME) indicate that New York state reached its peak for deaths per day on April 9, between April 13 and April 21, the model’s projected deaths through August 4 increased by 9,199, raising the forecasted deaths to 23,741*.
Wayne County, Michigan
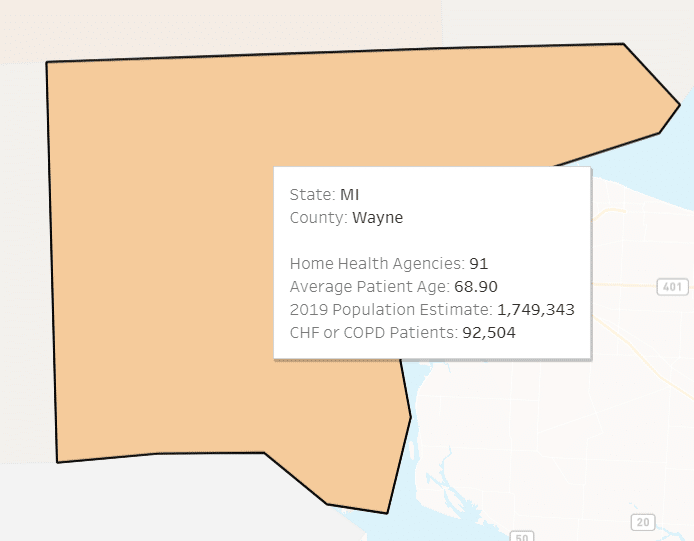
With 52.88 COPD+CHF patients per 1,000 population, the disease burden for Detroit’s Wayne County is close to the average value for the 50 counties Trella analyzed. Of the counties in our analysis, Wayne had the highest case fatality rate (CFR), at 8.25%, compared to the U.S. average of approximately 5.46% through April 21. This higher rate may be partially explained by Michigan’s vulnerability measures, given what we know about factors that adversely affect patient outcomes for those infected with COVID-19.
According to data from the COVID-19 Healthcare Coalition, the state’s median medical risk factor, made up of 10 underlying risk factors, is 64.77. Of greater concern are Michigan’s median component measures of 72.31 for smoking and 80.63 for asthma, respectively1. For reference, New York state’s median medical risk factor is 37.98 and Illinois’ is 37.001. This could indicate that Wayne County may take longer to flatten its curve than other areas with lower median medical risk factors while continuing to experience higher fatality rates. Similar to New York and Illinois, IHME adjusted Michigan’s total mortalities through August 4; the latest model predicts 3,361 deaths compared to the April 13 estimate of 2,373, representing a 41.6% increase14.
Cook County, Illinois

Of the 50 most-impacted counties, Cook tops the list for total COPD+CHF patients, with 250,000. When considering its COPD+CHF patients per 1,000 population of 48.54, Chicago’s home county is not far from the average for counties analyzed, 50.99. When compared to NYC, Cook has a much greater home health capacity, with one agency per 678 CHF+COPD patients, compared to NYC’s ratio of one per 3,443 patients. For reference, the mean and median among the top 50 counties are 2,684 and 1,827 COPD+CHF patients per agency, respectively.
Like New York, the latest forecast presumes Illinois has reached its zenith for daily deaths, peaking on April 18, while also adjusting to account for a significant projected increase in total deaths through the first wave of the pandemic. For Illinois, predicted overall deaths jumped almost 68%, from 1,248 to 2,093 in the span between April 13 and April 21. To date, Cook County comprises approximately 63.5% of the state’s COVID-19 mortalities and 70.1% of total cases.
2. Potential Emerging Hotspots
Trella identified the areas below as potential future hotspots. While these counties don’t currently have volumes as high as the known areas in terms of COVID-19 cases and deaths, we hypothesize they could face similar outcomes due to underlying risk factors.
Washington, D.C.

Our nation’s capital has the second-highest number of COPD+CHF patients per 1,000 population for the top 50 counties, with 103.693. The district has a higher ratio of home health agencies to COPD+CHF patients, though, with one for every 1,926 patients versus the average of 2,684 for the top 50 counties. With a median medical risk factor of exactly 50.0, according to the COVID-19 Healthcare Coalition, D.C. may not appear exceptionally vulnerable, but a couple of component measures stand out. For median asthma, D.C. has a measure of 91.85 and for median residents in nursing homes its measure is 75.83.
Given COVID-19’s impacts to the respiratory tract and potential to cause pneumonia, the CDC characterizes moderate to severe asthma as an underlying medical condition that increases the risk of serious illness with COVID-19 for people of all ages. As we saw in King County, Washington, and continue to see in skilled nursing facilities (SNFs) across the nation, COVID-19 has proven to be extremely contagious and fatal among residents of those communities, as the patient populations tend to be older and often have underlying medical conditions. Of note, the nearby city of Baltimore, Maryland, also has a high COPD+CHF disease burden, with 99.63 patients per 1,000. In contrast to D.C., Baltimore’s number of COPD+CHF patients per home health agency is 19,709, the most among the 50 counties analyzed3.
Cuyahoga County, Ohio
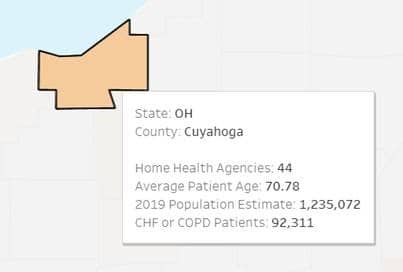
Home to Cleveland, multiple indicators point to Cuyahoga County as a potential future hotspot, including its rate of 74.7 COPD+CHF patients per 1,000 people. Eighth highest in the nation, Cuyahoga’s disease burden for the conditions is 47% greater than the mean of 51.0 for the 50 counties analyzed. Ohio also has some disconcerting medical risk factors, even if its overall medical risk factor of 57.23 is not particularly concerning. For instance, the state’s median smoking and heart disease component measures are 78.04 and 65.79, respectively1. While smokers are more likely to suffer from COPD and CHF than non-smokers and CHF is a type of heart disease, state component measures reflect vulnerability for the entire population rather than just its Medicare beneficiaries, meaning Ohio could see a greater share of severe COVID-19 cases across age groups.
As a comparison, D.C.’s median smoking component measure is only 16.07, and its median heart disease measure is just 7.81, despite its previously-mentioned 103.69 COPD+CHF patients per 1,000 people1. On a positive note, Cuyahoga County has greater than average home health capacity, with one agency per 2,098 COPD+CHF patients, compared to 2,874 COPD+CHF patients per agency for the 50 counties analyzed.
Maricopa County, Arizona
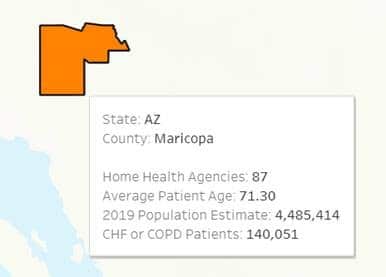
Comprised of nearly 4.5 million people, the state’s most populous county encompasses Arizona’s capital and its largest metropolitan area, Phoenix. Maricopa’s rate of COPD+CHF patients per 1,000 people is 31.22, approximately 40% less than the average for counties in the top 50 for COPD+CHF patients. The state’s median medical risk factor is 61.621. Although not an alarming number on its own, some of Maricopa’s median component measures raise concerns, particularly median asthma at 63.08 and median cancer at 94.631.
As covered above, asthma places an individual at higher risk; similarly, according to the CDC, cancer patients and survivors may be immunocompromised as a result of treatment, increasing their likelihood of requiring hospitalization or intensive care if infected with COVID-19. While Maricopa is well-positioned from a home health capacity perspective at one agency per 1,610 COPD+CHF patients, agencies could be stretched if hospitals are overwhelmed with vulnerable patient populations and therefore seeking to free up acute resources.
Suffolk County, Massachusetts

On a per 1,000 population basis, Suffolk County has the greatest number of COPD+CHF patients in the entire nation with 110.8, more than twice the average for the top 50 counties. Another risk factor is its 5,938 COPD+CHF patients per home health agency, also two times higher than the mean for the top 50 counties and three times greater than the median of 1,830.
While Suffolk and neighboring Middlesex County are both among the top 25 in the country for COPD+CHF patients, Massachusetts by and large does not appear particularly vulnerable from a medical standpoint. The state’s median medical risk factor is 28.44, and only one medical component measure, asthma at 52.99, is above 501. Because deaths per day for Massachusetts are estimated to have only peaked on April 19, according to IHME, we may not see a drop-off in cases and deaths as significant as the drop-offs noted in regions where daily deaths peaked earlier.
3. Notable Lower-Risk Areas
There were a few counties in the top 15 for highest number of COPD+CHF patients that Trella does not consider current or future hotspots: Los Angeles and San Diego counties in California, and Harris and Dallas counties in Texas. Each of these counties exhibits lower risk across other criteria. Both L.A. and San Diego counties have among the five lowest rankings for prevalence of COPD+CHF patients per capita, with rates of 21.84 and 25.25, respectively. In terms of COPD+CHF patients per home health agency, Dallas has the fewest in the top 50 counties with just 274, while Harris is also in the top five with 395. While each of these four counties are likely to see a high overall number of COVID-19 cases due to their population density, we do not anticipate they’ll experience as many critical cases as other counties, in terms of hospitalization and case fatality rates. Trella will continue to monitor these areas to see if they in fact represent greater cause for concern than we currently assess.
Trella Health’s Commitment
In addition to producing this heatmap and analysis, Trella is serving the healthcare community in other ways during the COVID-19 pandemic. We’re offering free, personalized insights to acute and post-acute providers based on our dataset and have put together several helpful resources, including blog posts and a webinar. You’ll find more information on each resource below:
- Request a personalized, data-driven insight for your Home Health Agency or Hospice
- Request a personalized, data-driven insight for your Hospital or Health System
- Watch our webinar recording: Maintaining Business Development Efforts During COVID-19
- Read our blogs:
- Join our LinkedIn group to continue the conversation: Post-Acute Care Leadership Network
Trella is committed to helping those on the front lines respond to COVID-19 in any way we can. For more information or questions on how we can empower your organization, please contact [email protected]
*Of note: To account for probable deaths, IHME has updated its methodology and source data, pulling from the NY Times GitHub repository and subtracting reported deaths for each day (based on the NY Times data set) from the NYC Department of Health and Mental Hygiene (DOHMH)’s total count of COVID-19 deaths.
Sources:
-
“Tracking Vulnerable Population by Region,” Median vulnerable measures dashboard, COVID-19 Healthcare Coalition. Accessed April 21, 2020, https://c19hcc.org/resource/vulnerable-population
-
“State Data and Policy Actions to Address Coronavirus,” Kaiser Family Foundation. Accessed April 21, 2020, https://www.kff.org/health-costs/issue-brief/state-data-and-policy-actions-to-address-coronavirus/
-
“Tracking Vulnerable Population by Region,” Median vulnerable measures dashboard, COVID-19 Healthcare Coalition. Accessed April 21, 2020, https://c19hcc.org/resource/vulnerable-population
-
“Estimates of the severity of coronavirus disease 2019: a model-based analysis,” Robert Verity, Lucy C. Okell, et al. The Lancet. Accessed April 21, 2020, https://www.thelancet.com/action/showPdf?pii=S1473-3099%2820%2930243-7
-
“Severe Outcomes Among Patients with Coronavirus Disease 2019 (COVID-19) — United States, February 12–March 16, 2020,” Morbidity and Mortality Weekly Report, CDC. Accessed April 21, 2020, https://www.cdc.gov/mmwr/volumes/69/wr/mm6912e2.htm?s_cid=mm6912e2_w
-
“The epidemiological characteristics of an outbreak of 2019 novel coronavirus diseases (COVID-19) in China,” National Center for Biotechnological Information (NCBI). Accessed April 21, 2020, https://www.ncbi.nlm.nih.gov/pubmed/32064853
-
“People Who are at Higher Risk for Severe Illness,” Centers for Disease Control and Prevention (CDC). Accessed April 21, 2020, https://www.cdc.gov/coronavirus/2019-ncov/need-extra-precautions/people-at-higher-risk.html
-
“Older Adults,” Centers for Disease Control and Prevention (CDC). Accessed April 21, 2020, https://www.cdc.gov/coronavirus/2019-ncov/need-extra-precautions/older-adults.html
-
“Groups at Higher Risk of Severe Illness,” Centers for Disease Control and Prevention (CDC). Accessed April 21, 2020, https://www.cdc.gov/coronavirus/2019-ncov/need-extra-precautions/groups-at-higher-risk.html
-
“Report of the WHO-China Joint Mission on Coronavirus Disease 2019 (COVID-19),” World Health Organization (WHO). Accessed April 21, 2020, https://www.who.int/docs/default-source/coronaviruse/who-china-joint-mission-on-covid-19-final-report.pdf
-
“Vital Surveillances: The Epidemiological Characteristics of an Outbreak of 2019 Novel Coronavirus Diseases (COVID-19),” China CDC Weekly. Accessed April 21, 2020, http://weekly.chinacdc.cn/en/article/id/e53946e2-c6c4-41e9-9a9b-fea8db1a8f51
-
“COVID-19 Projections: Transitioning from Social Distancing to Containment,” Institute for Health Metrics and Evaluation (IHME). Accessed April 21, 2020, http://www.healthdata.org/
-
S. COVID-19 Projections. Institute for Health Metrics and Evaluation (IHME). Accessed April 21, 2020, https://covid19.healthdata.org/united-states-of-america
-
COVID-19 projection updates. Institute for Health Metrics and Evaluation (IHME). Accessed April 21, 2020,
http://www.healthdata.org/covid/updates
Let us show you how we can help your business grow


